TECHNICAL INFORMATION
THE LOGIC AND CODE BEHIND THE COVER & TOC GRAPHS
DOI:
https://doi.org/10.14244/eahb.v35iSpecialIssue.13Abstract
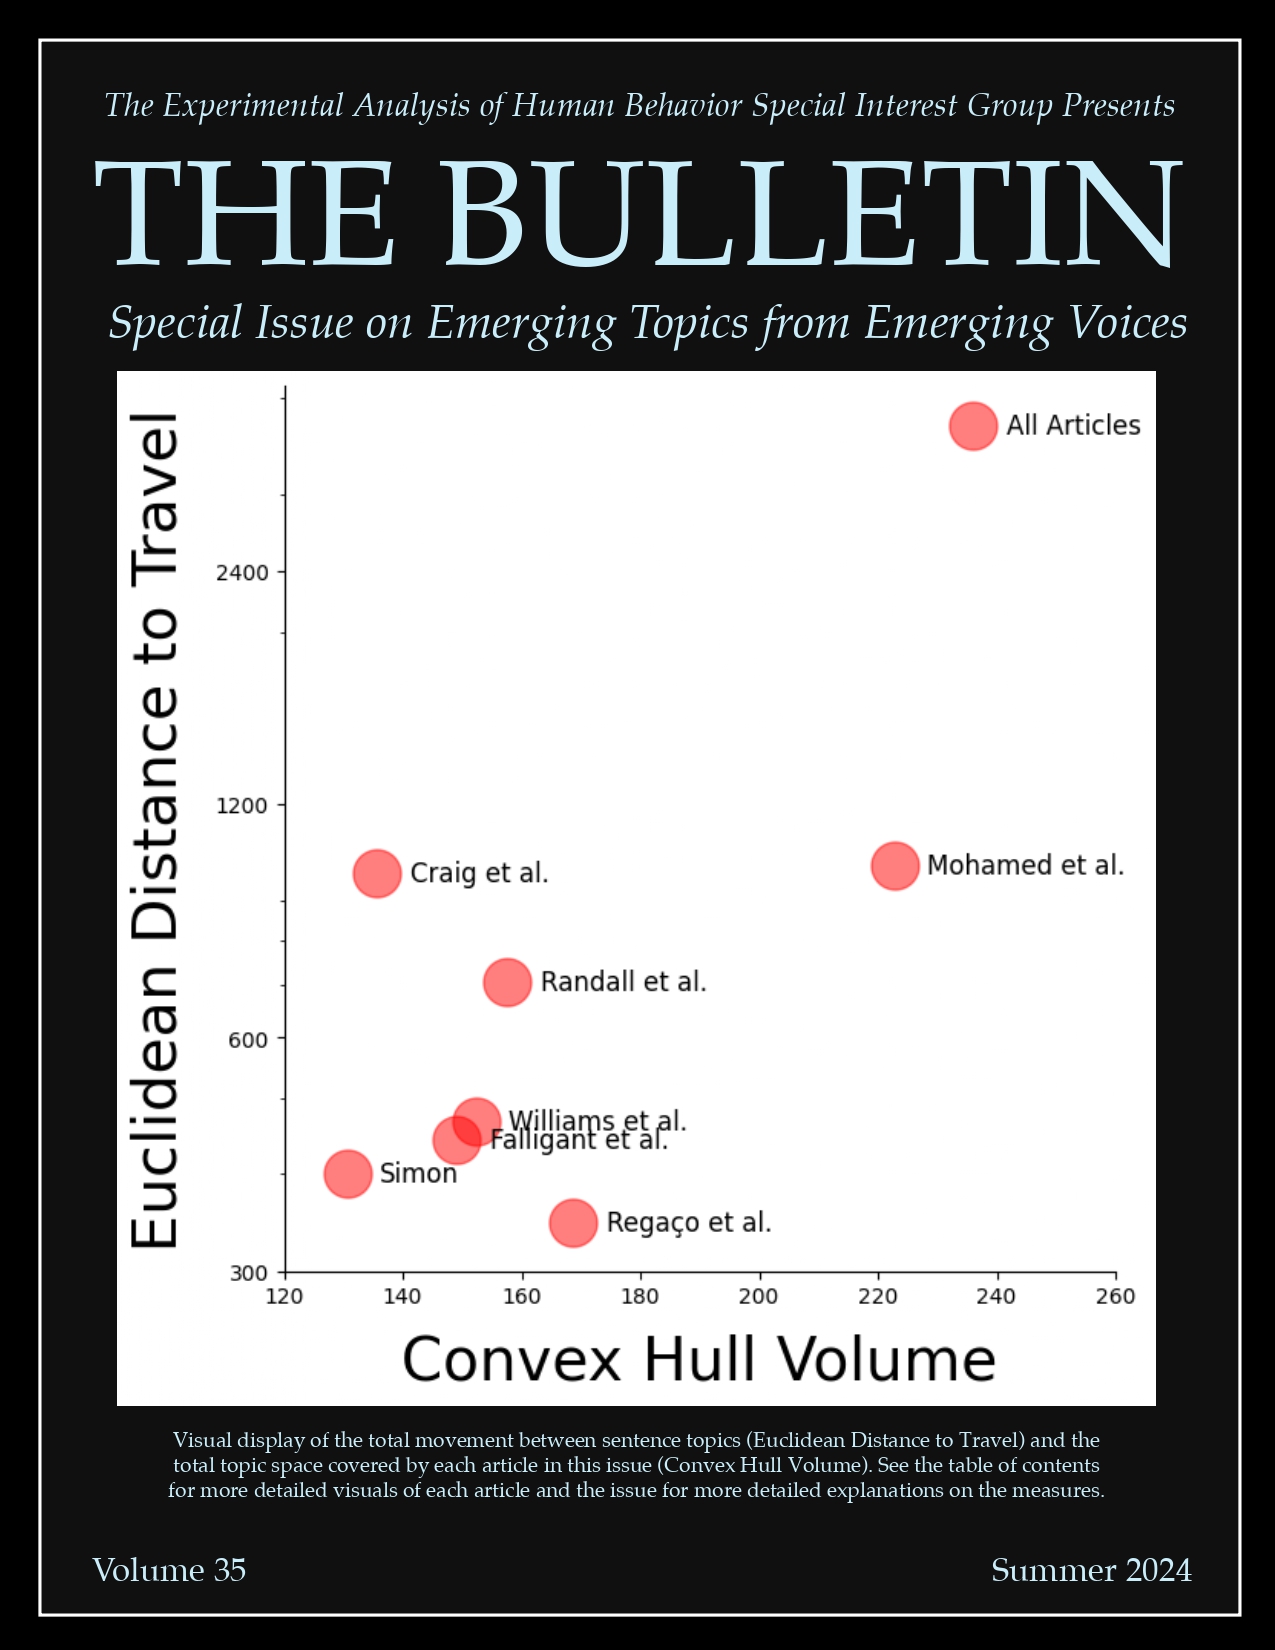
Visualizing behavioral data in unique ways may lead to novel methods of analysis and, perhaps, new ways of thinking about environment-behavior relations. In the spirit of transparency and to help others discover interesting things in their own textual data, below is the code to create the plots shown on the cover and table of contents in this volume. Some familiarity with Python is needed (i.e., how to open a script, read in files, and execute the program). A downloadable file of the referenced Python script is available here: https://osf.io/b6xuh/. If the code is all you’re after, you can stop reading here. Otherwise, the text below describes a bit more about the mathematical and computational logic behind the individual article figures, how they relate to the data shown on the cover page, and why certain decisions were made. Happy coding and playing!
Downloads
Published
How to Cite
Issue
Section
License
Copyright (c) 2025 Experimental Analysis of Human Behavior: Bulletin

This work is licensed under a Creative Commons Attribution-NonCommercial 4.0 International License.


